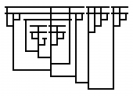
I always have a hard time making sense of preference matrices in two-player games. Here are some diagrams I drew to make it easier. This is a two-player game:

North wants to end up on the northernmost point, and East on the eastmost. North goes first, and chooses which of the two bars will be used; East then goes second and chooses which point on the bar will be used.
North knows that East will always choose the easternmost point on the bar picked, so one of these two:

North checks which of the two points is further north, and so chooses the leftmost bar, and they both end up on this point:

Which is sad, because there’s a point north-east of this that they’d both prefer. Unfortunately, North knows that if they choose the rightmost bar, they’ll end up on the easternmost, southernmost point.
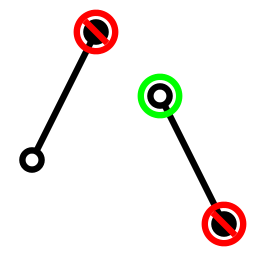
Unless East can somehow precommit to not choosing this point:

Now East is going to end up choosing one of these two points:

So North can choose the rightmost bar, and the two players end up here, a result both prefer:

I won’t be surprised if this has been invented before, and it may even be superceded – please do comment if so :)
EDIT: here’s a game where East has to both promise and threaten to get a better outcome:


You probably know that already, but Thomas Schelling uses simple graphs and letters in “Strategy of Conflict”, for example:
I think this is a standard way of depicting two-player games, I swear I saw similar charts in at least one other econ/game-theory book I read some time ago.
I’ve read SoC so I must have seen these, but I must have forgotten when I wrote this post. So the innovation here is the line connecting the options that the second player chooses between. Thanks for drawing it to my attention!
Thanks for these! Much easier to internalize than the standard matrices.